Explore the logs
The Logs explorer (/logs) is where you investigate production behavior. It does
not copy your trace payloads — every row is derived from the authoritative trace,
span, model-call, cost, and score records.
Step 1 — Start with a bounded query
Open/logs. The query bar accepts one clause per field, joined by AND. Start
narrow:
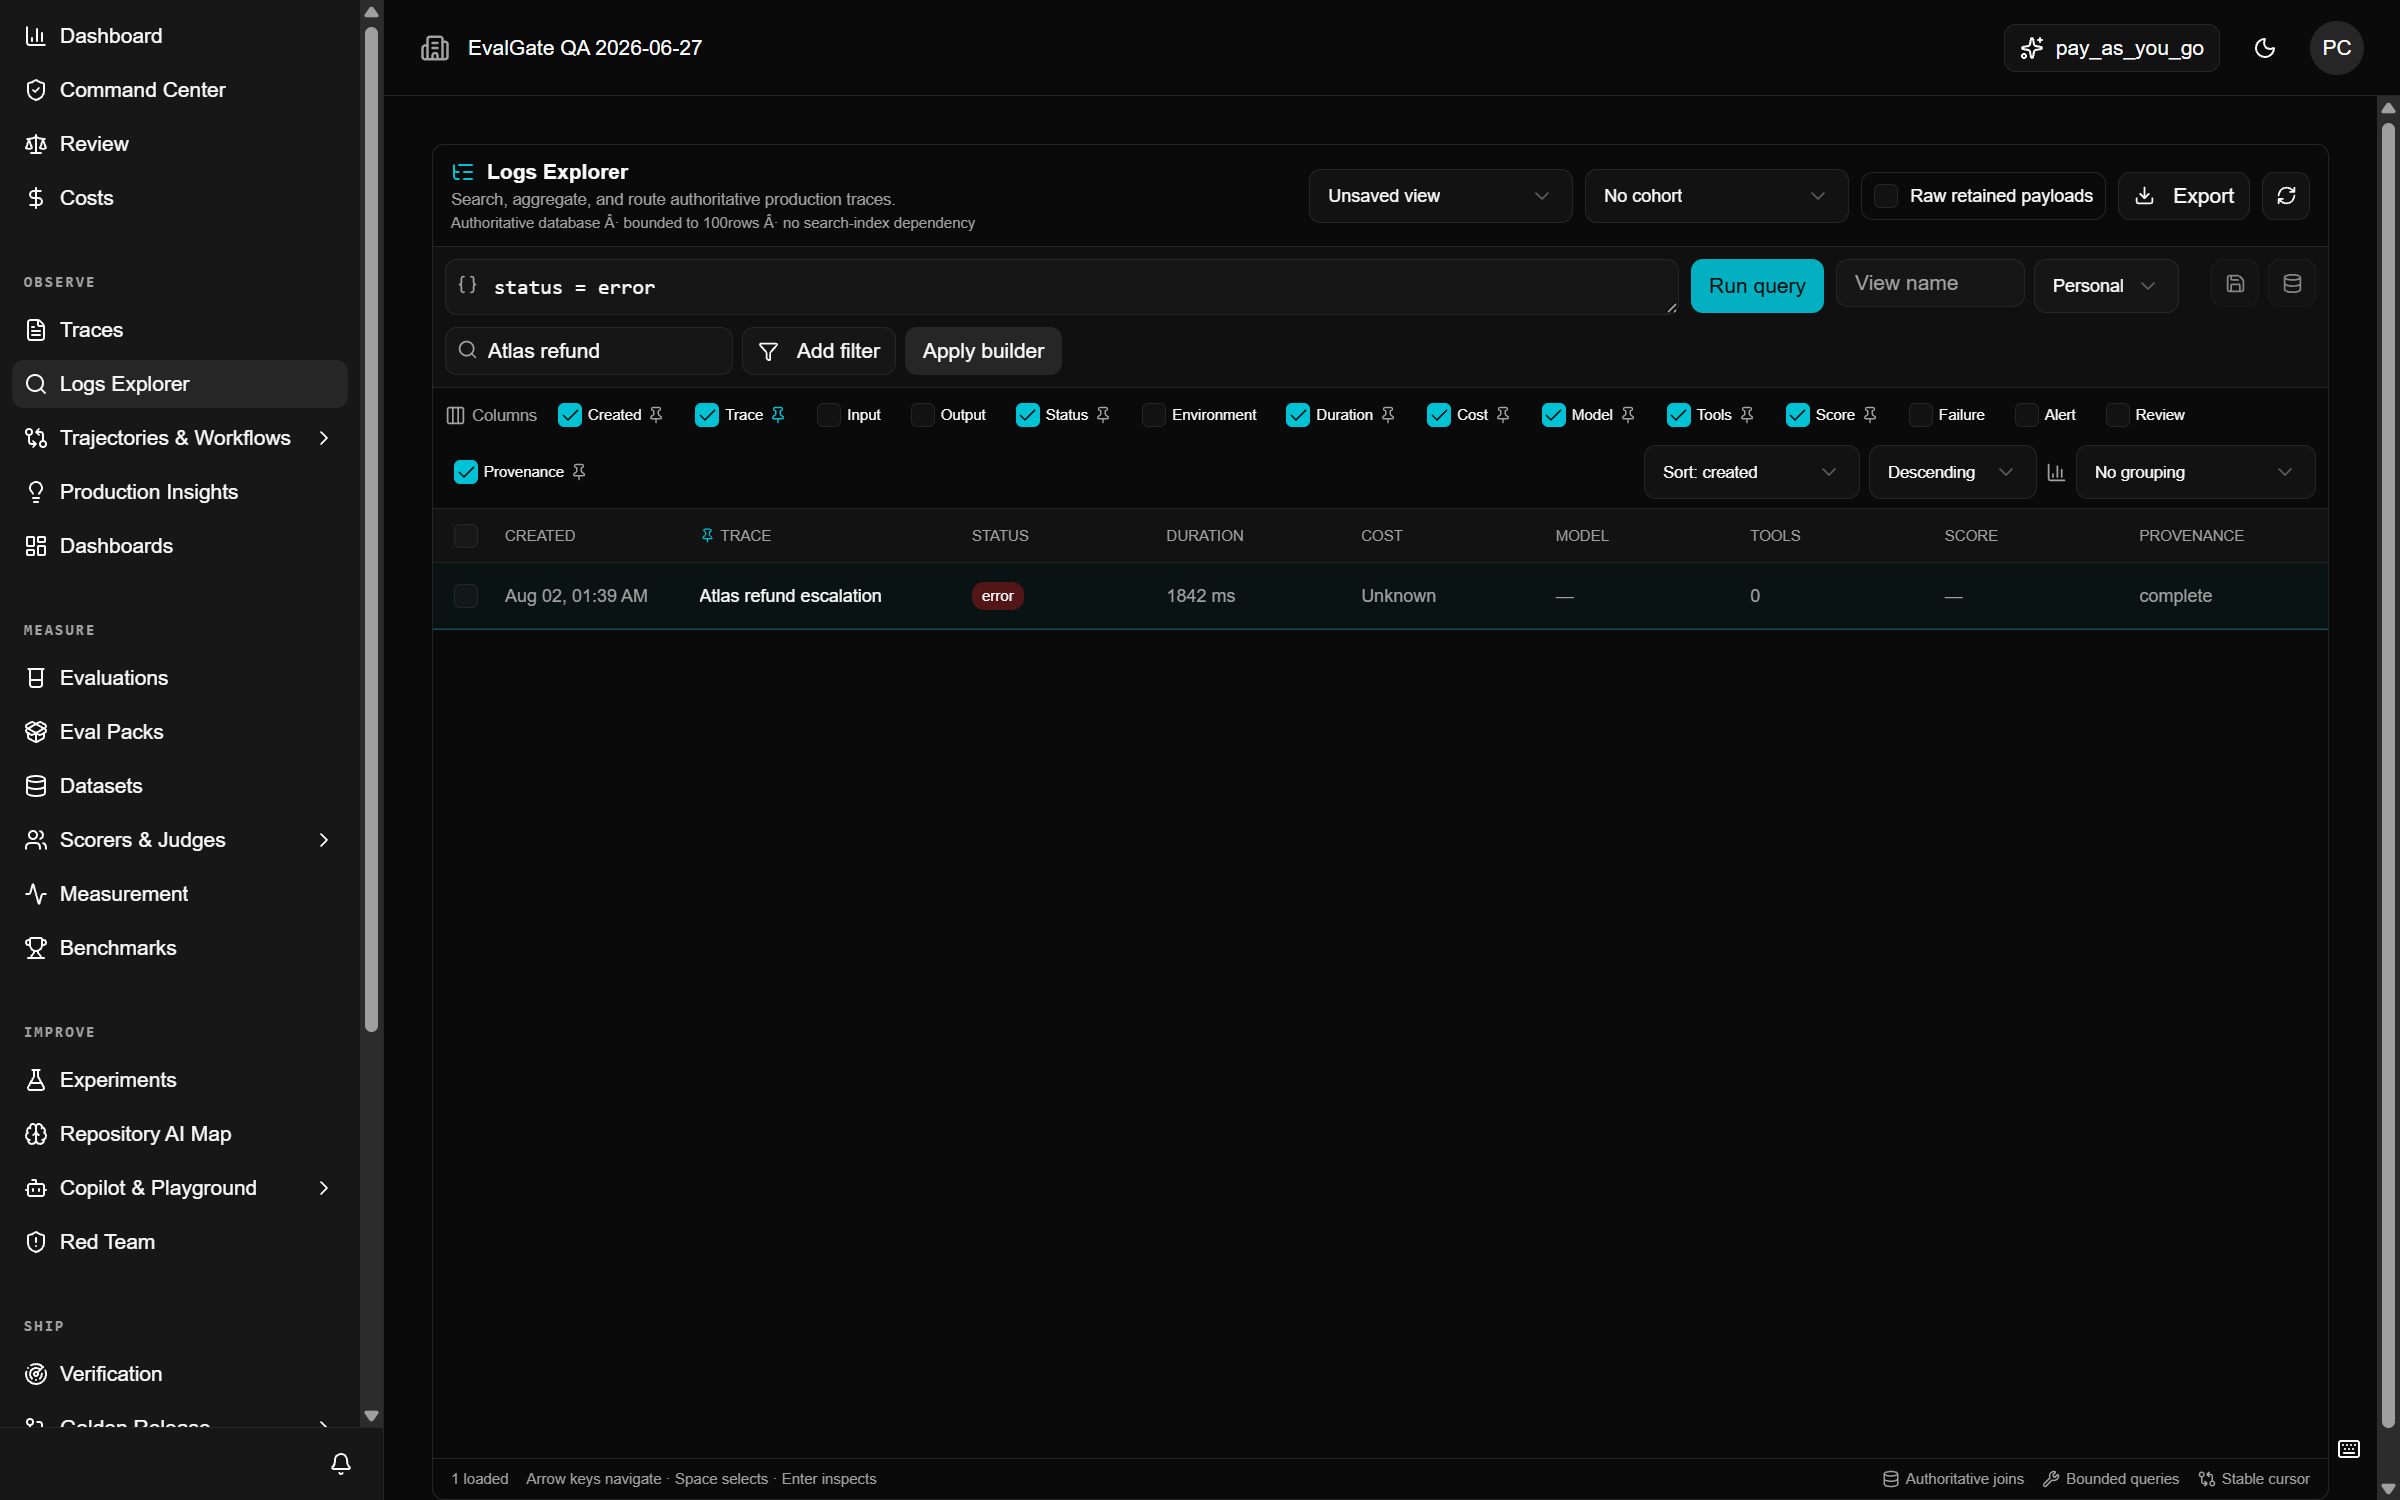
Use free text (
text ~ ...) after structured filters have narrowed the
result set. Free text first is slow and broad.Step 2 — Group the results
Use Group by to cluster by status, provider, model, failure category, alert state, or tag. You can compare count, known cost, average duration, p95 model latency, and average score without leaving the query.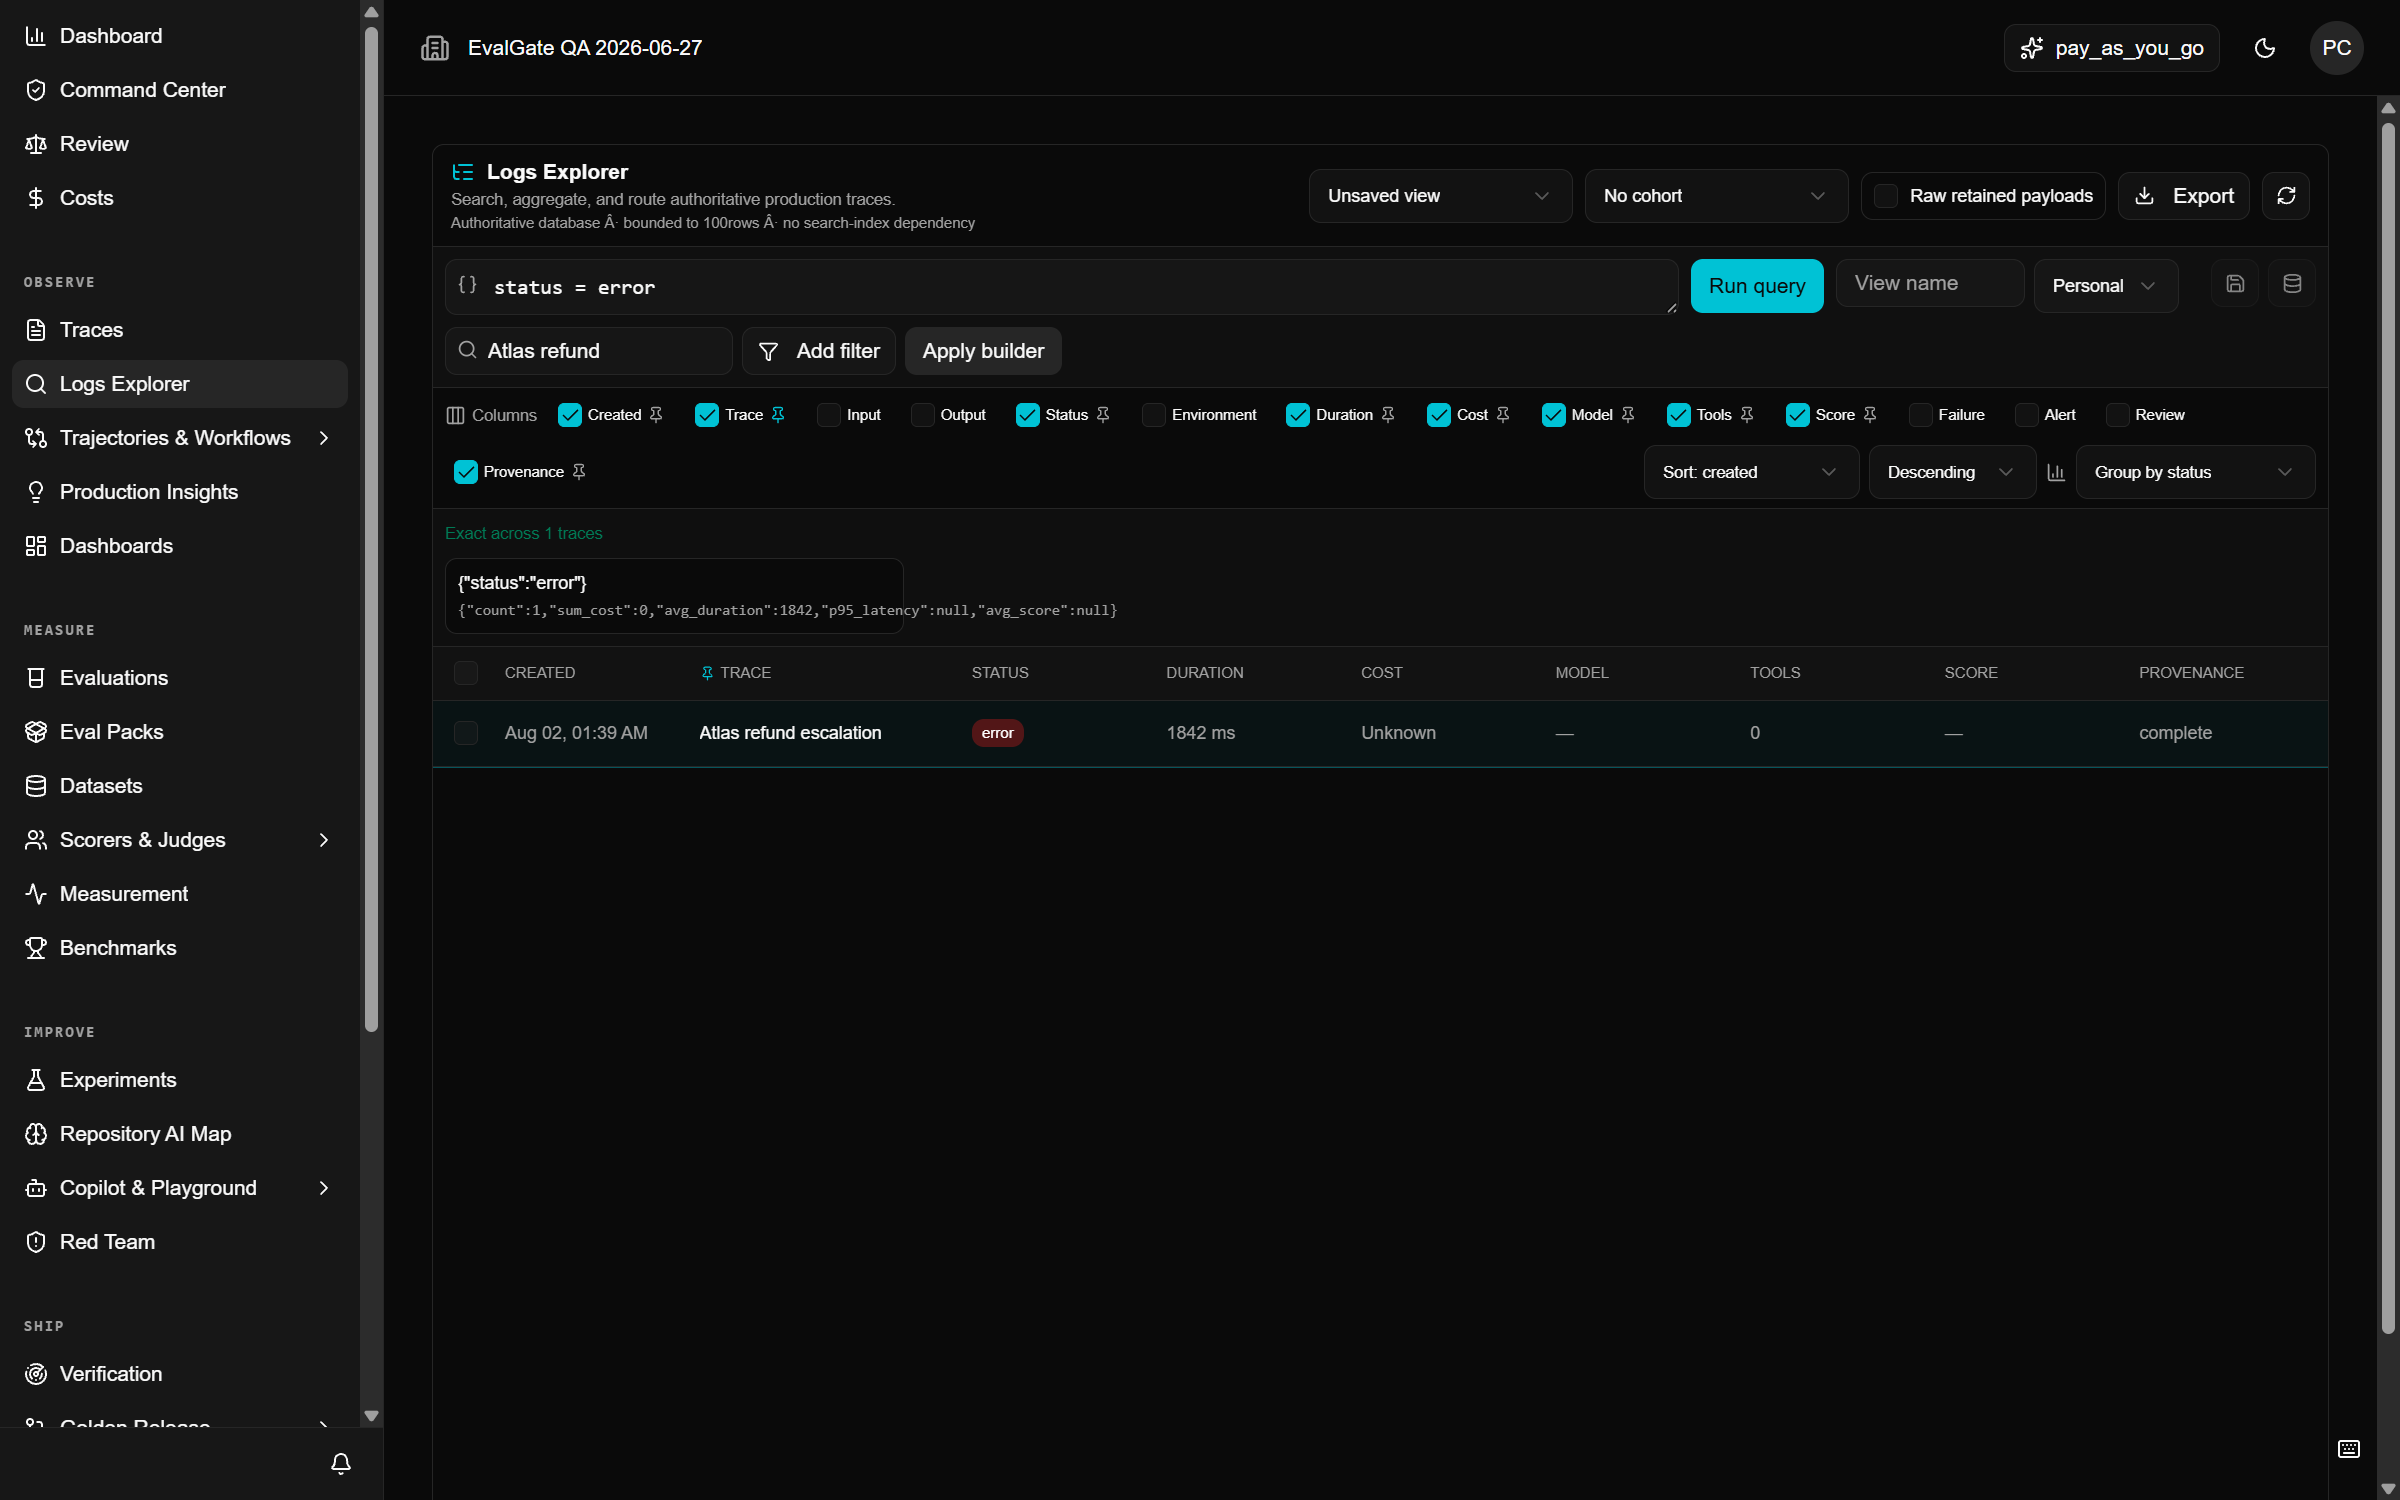
Step 3 — Sort and page
Pick one cursor-safe sort (for example, bycreated descending). Pages contain at
most 100 traces; use Load more to continue. Detail collections (spans, tools,
scores) continue independently after 100 records.
Step 4 — Act on what you found
Select traces and:- Create candidate — turn a real failure into a reviewable candidate.
- Open in Playground — reproduce the failure against a prompt variant.
- Create review task — hand the trace to a teammate.
- Create draft monitor — start a Continuous Eval monitor from this query.
- Export — download a bounded, redacted CSV or JSONL file.
Limits to know
- At most 20 structured filters per query.
- One primary cursor-safe sort.
- Exports stop at 5,000 rows or 5 MiB.
- Raw payload export is a privileged, audited operation.