Finding your way around EvalGate
The EvalGate web app has two main areas: the sidebar on the left and the main panel on the right. Everything you do happens in one of them.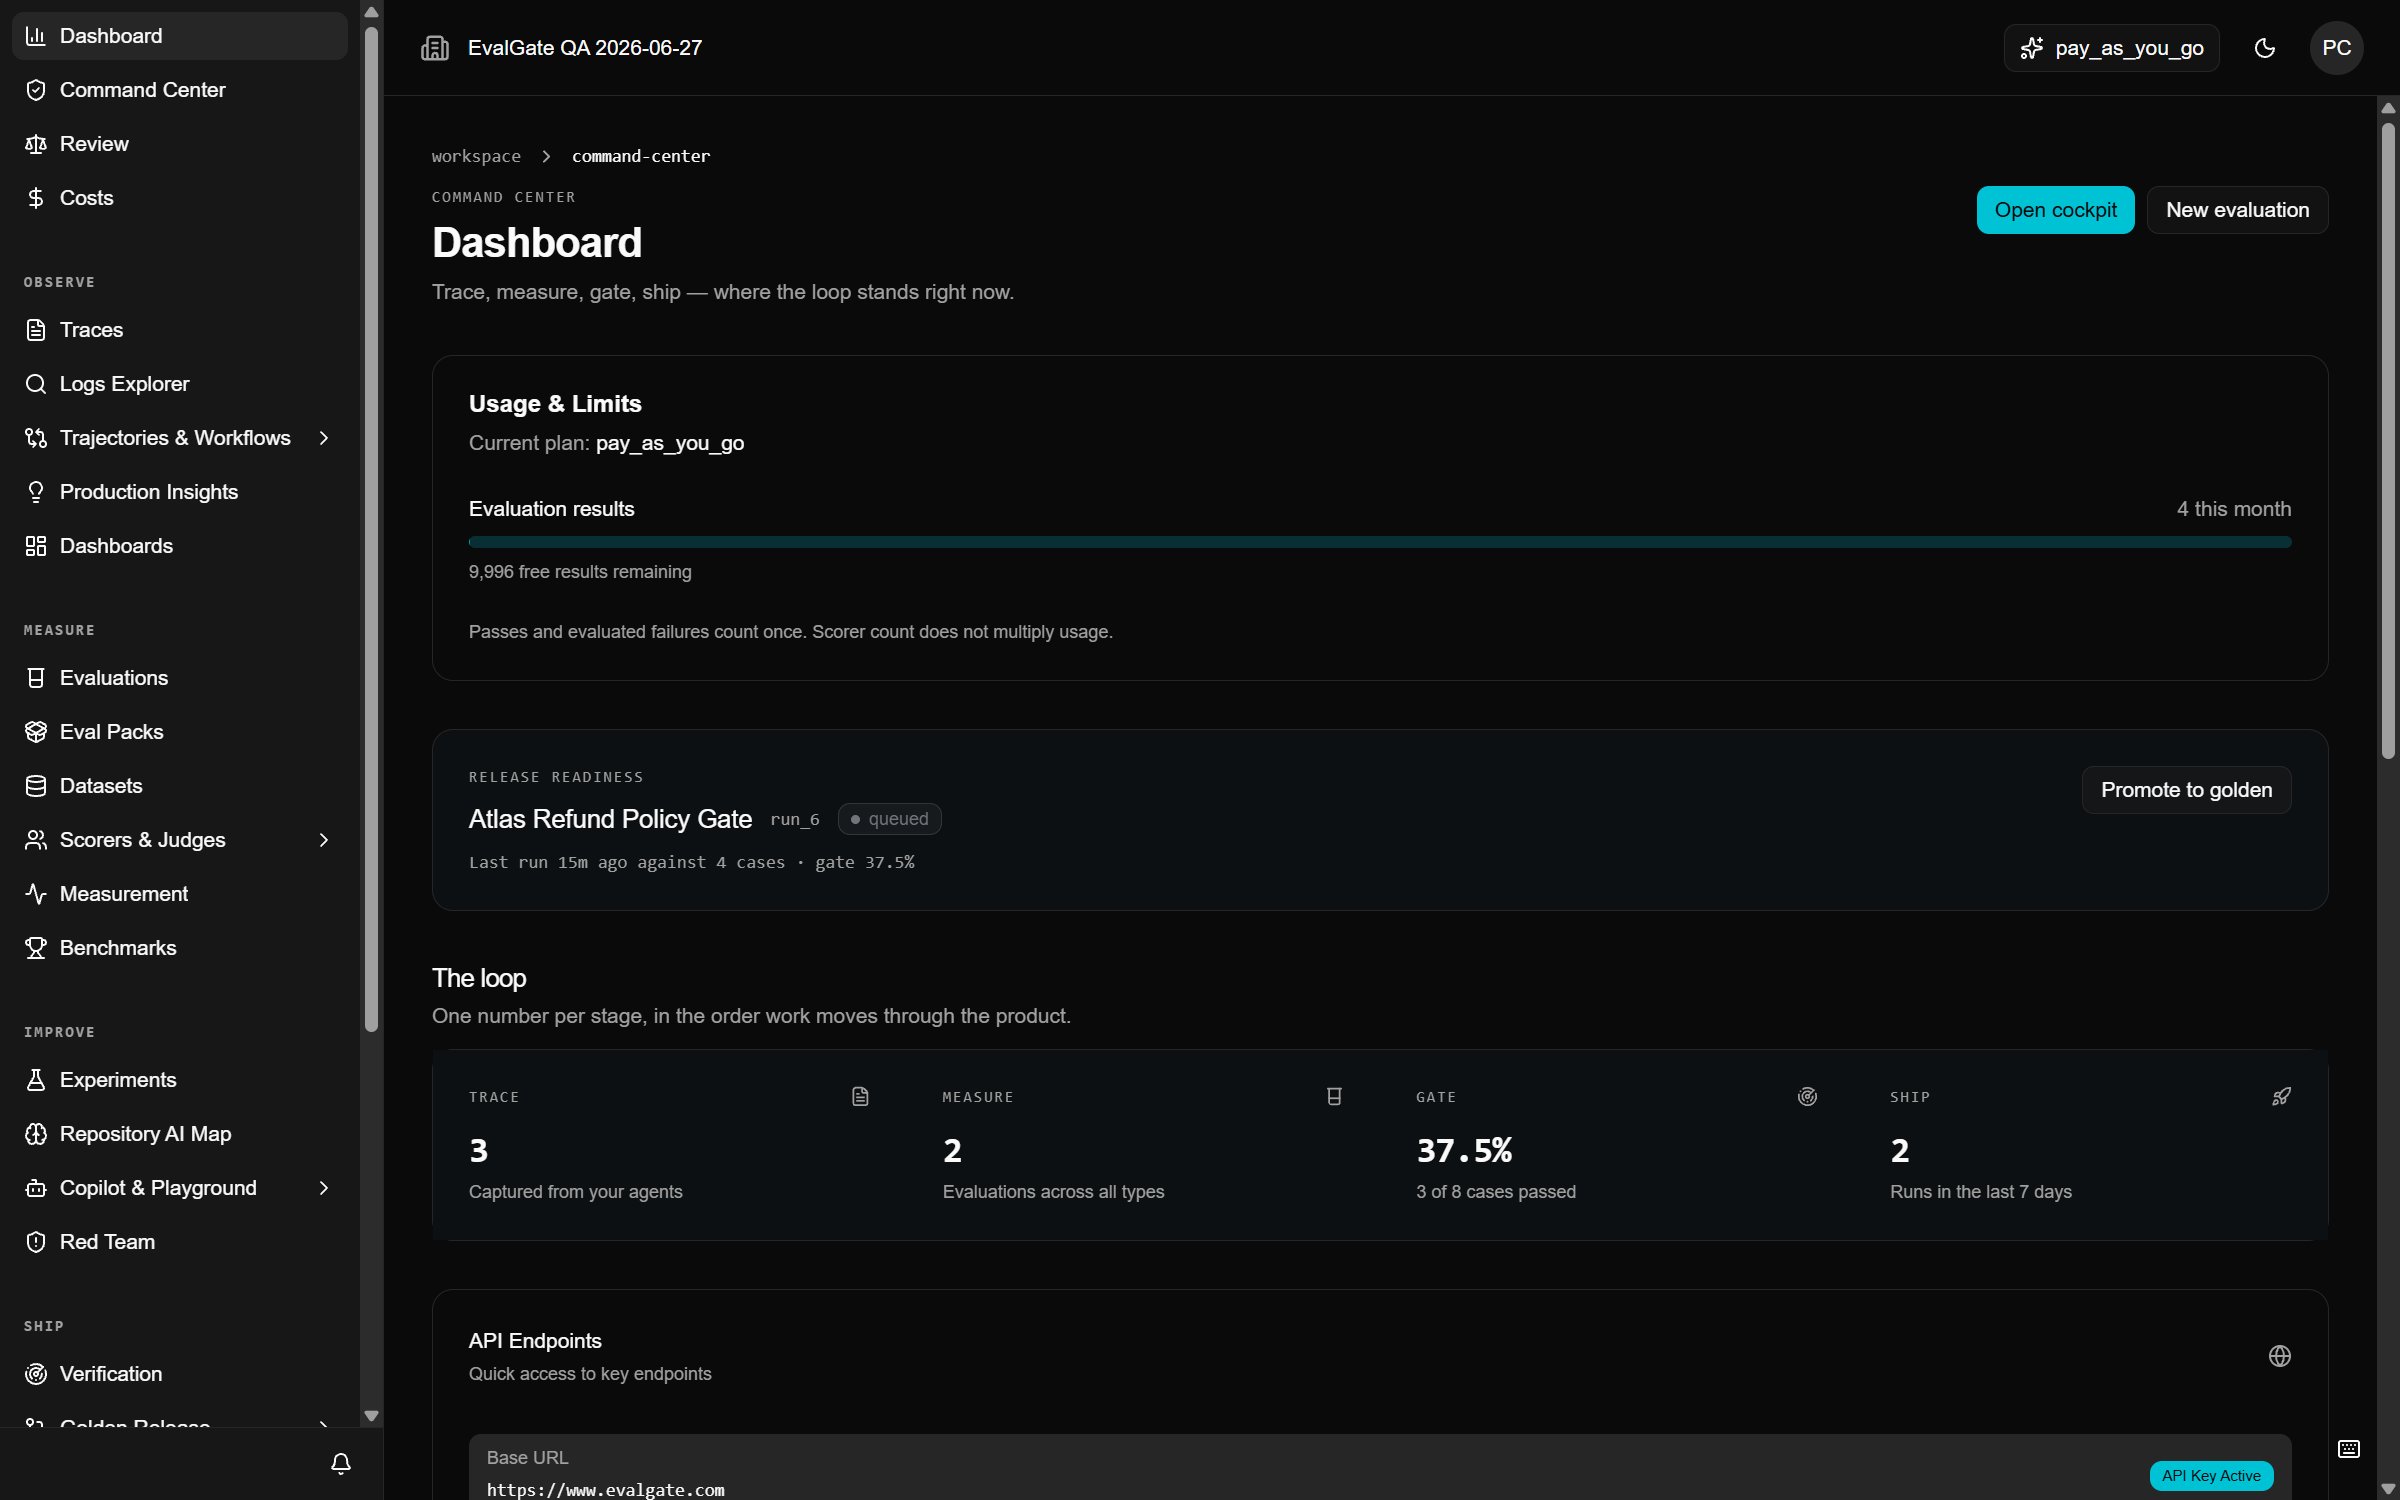
The sidebar
The sidebar is how you move between features. It is shaped as a loop — observe, measure, improve, ship — with a few pinned destinations above it.- Pinned — Release readiness (
/agent-evidence), Review, and Costs. - Observe — Traces, Logs Explorer, Trajectories & Workflows, Production Insights, and Dashboards.
- Measure — Evaluations, Eval Packs, Knowledge Network, Datasets, Scorers & Judges (Scorers, LLM Judge, Calibration, Annotations), Measurement, and Benchmarks.
- Improve — Experiments, Repository AI Map, Playground (Playground and Prompts), and Red Team.
- Ship — Verification (
/eval-loop), Golden Release, and Continuous Eval. - Developer — API keys, remote runners, deployable assets, and asset portability.
/copilot for proposal history. The workspace switcher at the top of the
sidebar changes workspaces, opens settings, and signs out. There is no mounted
command palette (Cmd+K) and no Records chrome section.
If the sidebar is in your way, click the collapse icon at the top to hide it.